01
Unified, real‑time access to all employee data
Access live, consolidated employee information instantly across the entire system.
 Solutions
Real‑time, pivot‑style analytics that let you slice, dice and understand your organisational data instantly.
Business Analytics gives you interactive, pivot‑table‑style reporting with real‑time access to employee and organisational data, enabling fast, flexible analysis across multiple dimensions so you can make informed decisions without waiting for a reporting cycle.
Analyse information the way you want, with drag‑and‑drop simplicity.
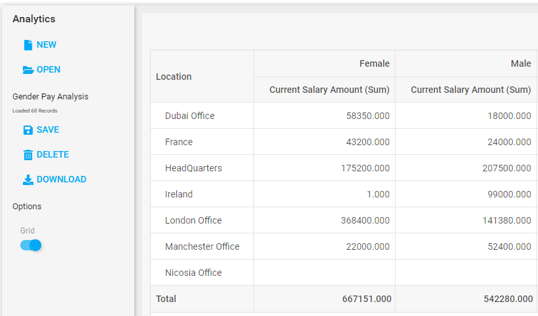
The information you need, exactly when you need it.
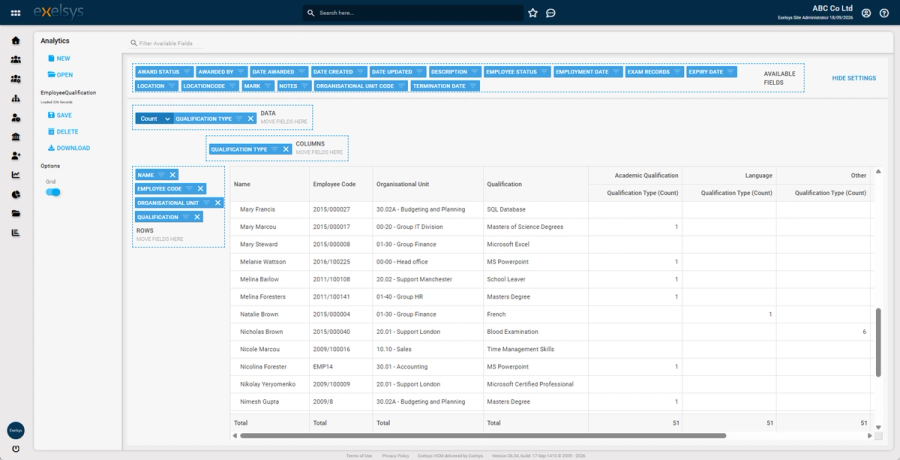
Build reports on the fly with full control over structure and content.
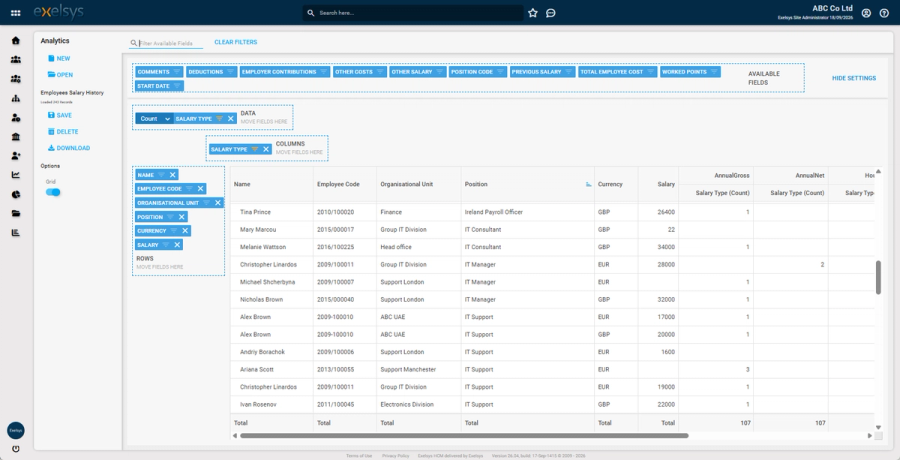
Access live, consolidated employee information instantly across the entire system.
Break down data by any dimension to uncover patterns and trends.
Analyse your data dynamically with drag‑and‑drop, Excel‑like pivot functionality.
See the full organisational picture to support fast, informed decisions.
An innovative, cost-effective HR solution that automates key processes, from holiday approvals and training requests to appraisals, expense claims, and beyond.
A powerful, centralised hub for managing all employee data throughout the entire employment lifecycle.
Automate leave policies, reduce absenteeism and give employees self-service holiday and sickness booking.
'/%3e%3cpath%20d='M300.2,290%20L245.9,290%20L160.2,152%20L245.9,14%20L300.2,14%20L210.4,152%20Z'%20fill='url(%23exelsysXGradRight)'/%3e%3c/svg%3e)

